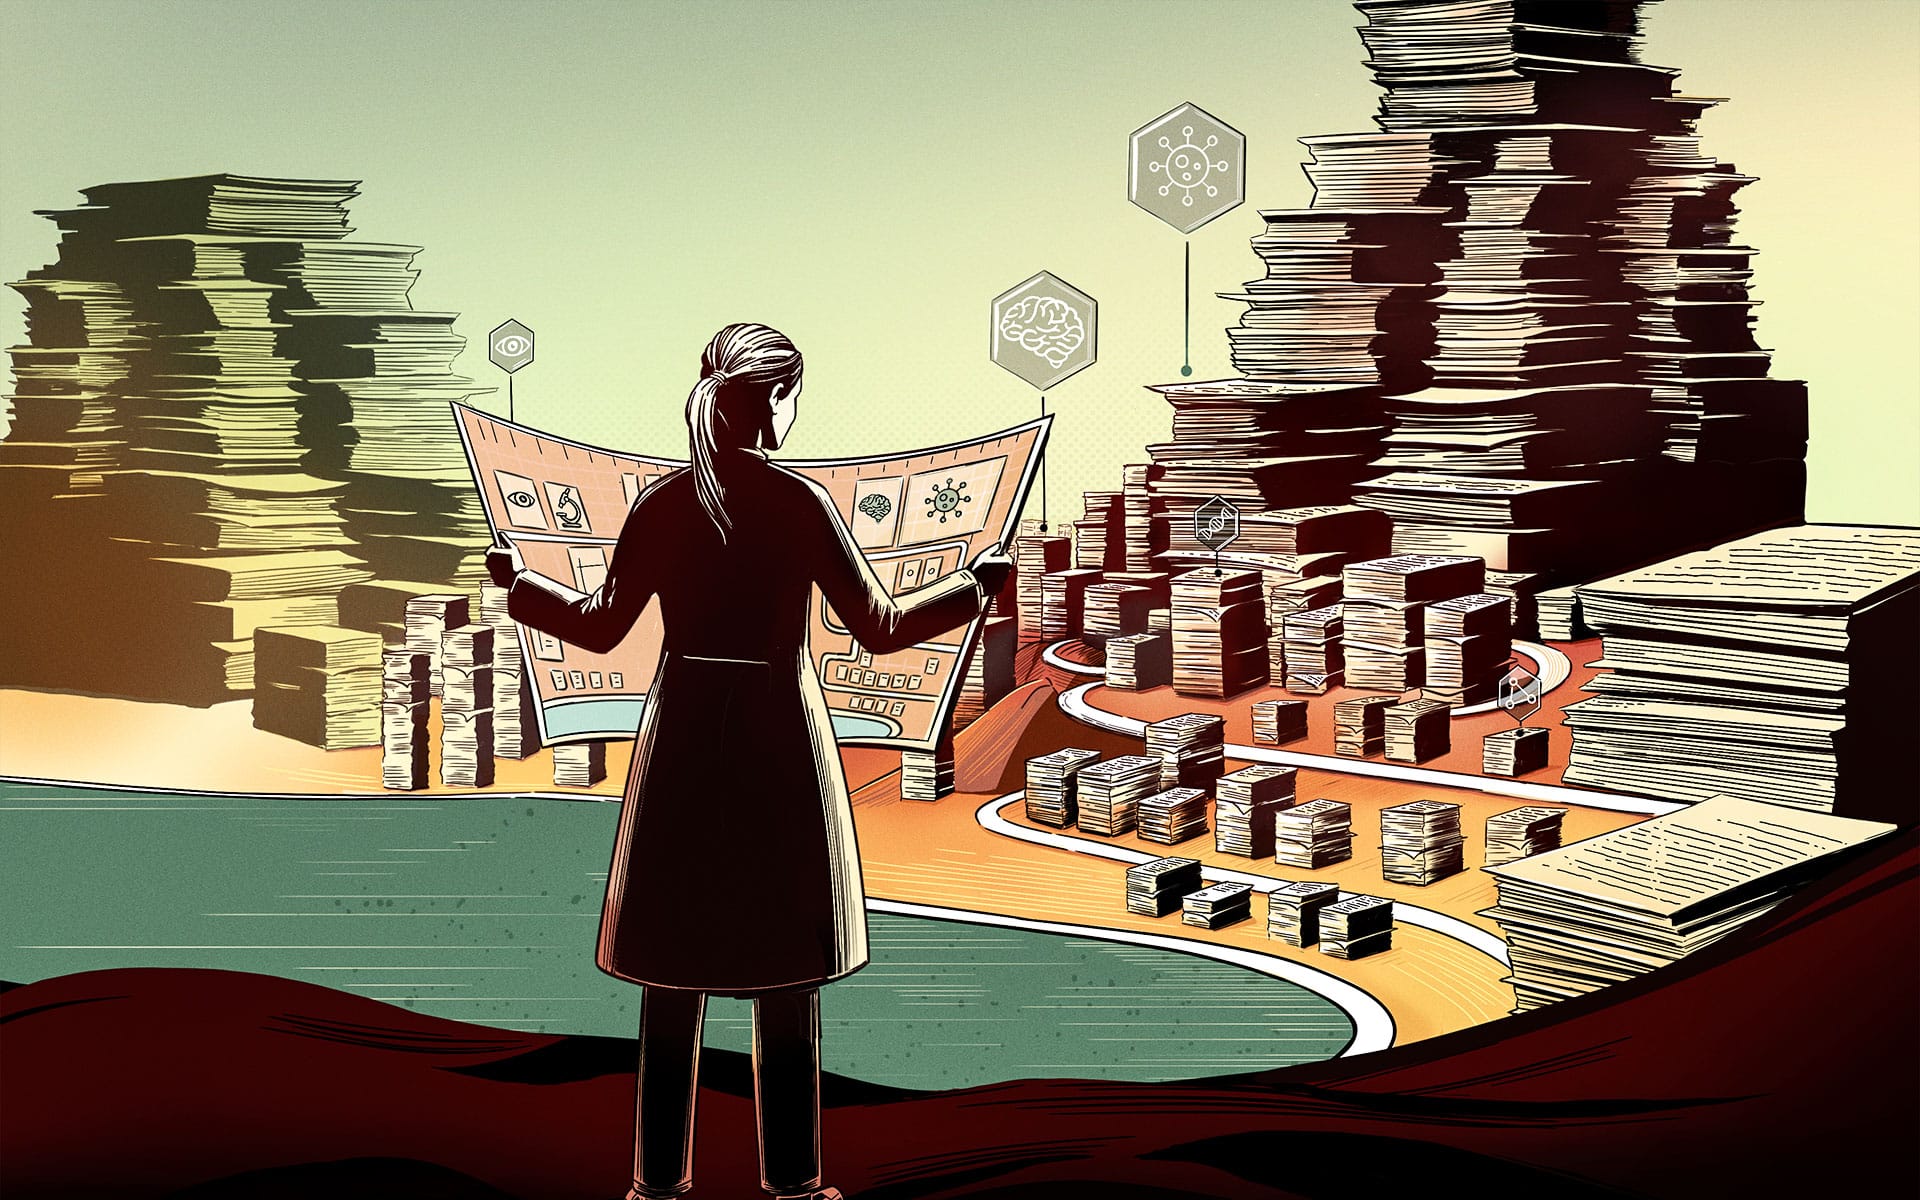
Imagine you are a historian, and you would like to understand the impact that the Covid-19 pandemic has had on the scientific literature. After a quick search of the term “covid-19”, you will feel overwhelmed by the deluge of information, since every year more than one million scientific articles are published in the fields of biomedicine and life sciences. Search engines, like Google Scholar, allow you to find specific papers, but don’t give you an overview of all existing papers. Therefore, it would be difficult to see how Covid-19 papers evolved over time or how they are connected to other fields, without having to spend months reading the literature.
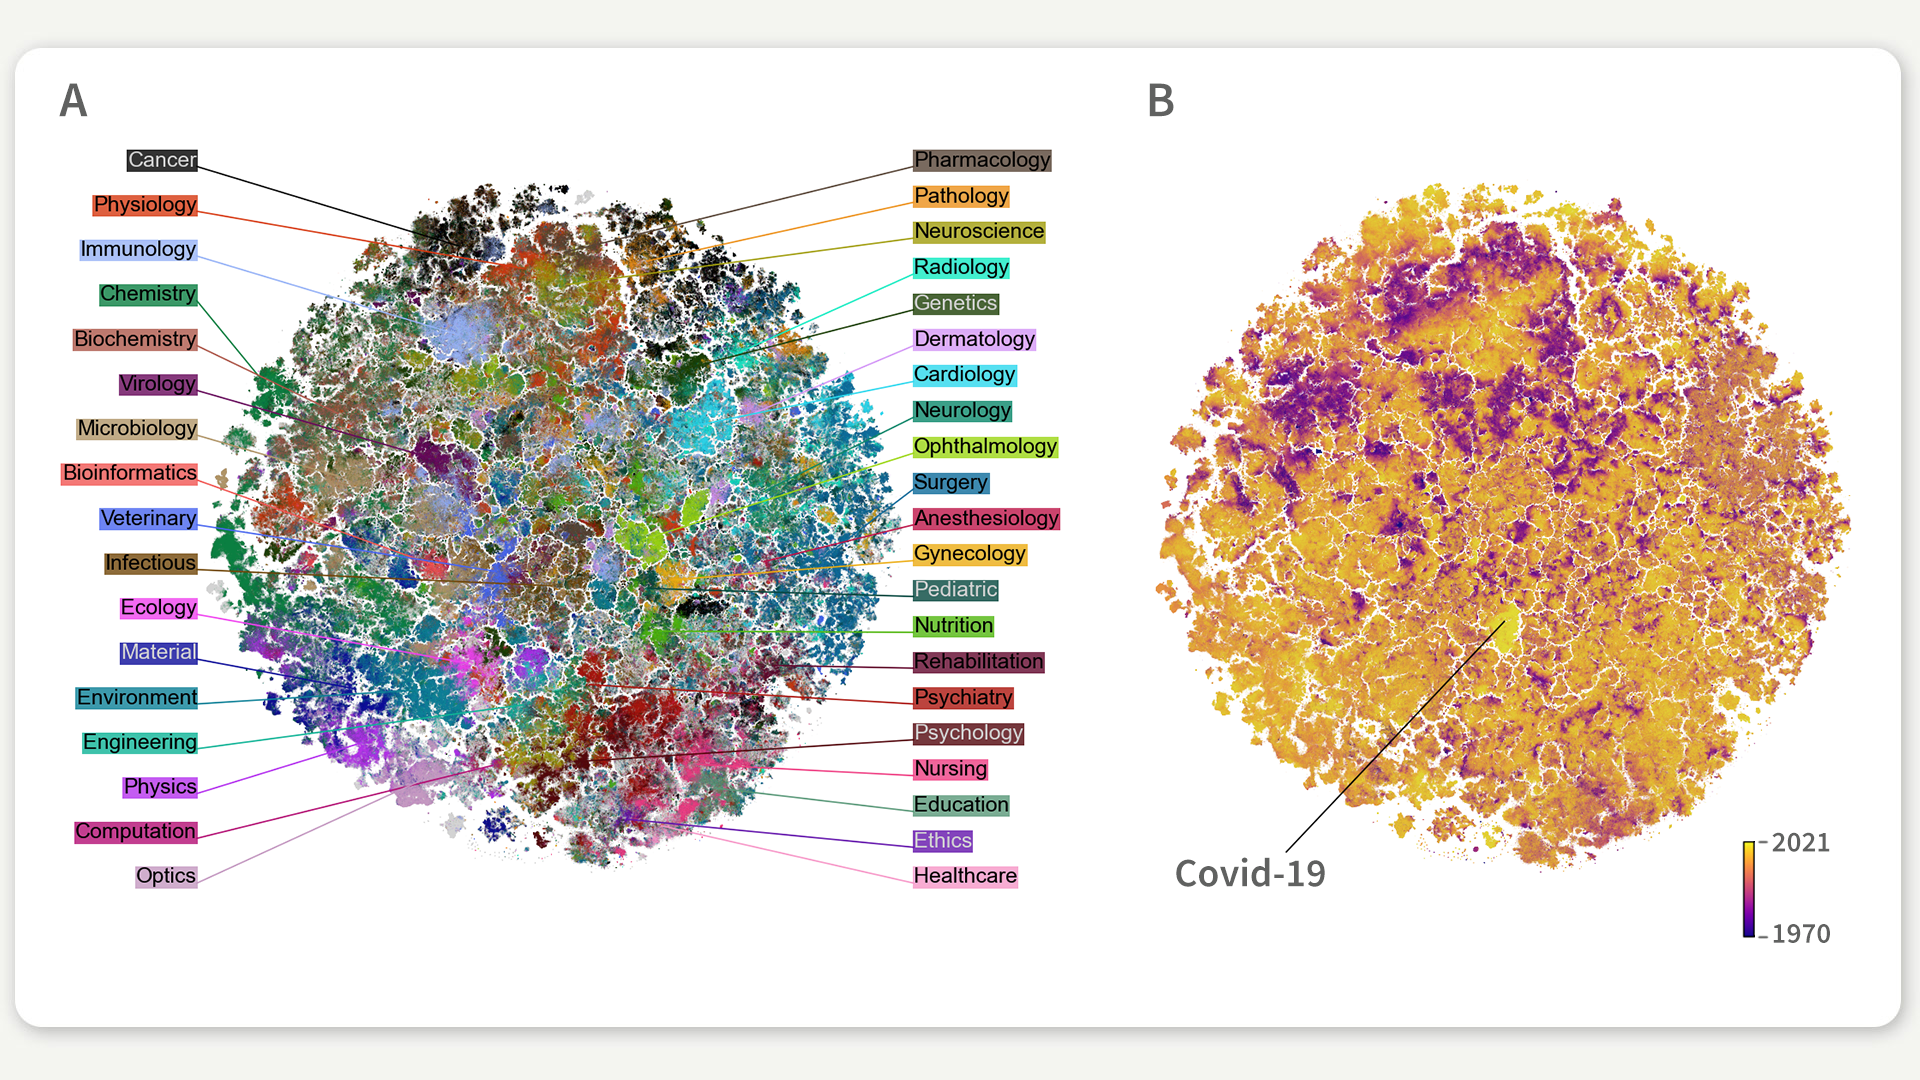
Figure 1: Map of the biomedical landscape, colored by (a) discipline, (b) year of publication. Each point in the map corresponds to one of the 20 million scientific articles indexed in the PubMed database.
To help the future historian and other researchers in similar situations, we created a map of the complete biomedical literature that allows you to navigate 20 million papers simultaneously and see their connections. It is based on all the scientific articles from PubMed, one of the best-known databases for biomedicine and life sciences, that covers many different disciplines, ranging from physics and engineering to biology or cardiology. As you can imagine, it is a complex challenge to organize so many articles from such diverse topics into a map. That is why we use machine learning methods to help us with the task.
The map is interactive and, apart from providing an overview of the biomedical literature, it allows zooming into the very fine details of each discipline and searching by title, journal name, author, or keywords. That way, the historian could find Covid-19 articles in the map and see to which other disciplines they are related. In fact, they would find that almost all Covid-19 papers are grouped in one island in the middle of the map (bright yellow island in figure 1b), surrounded by papers on other epidemics and respiratory diseases. Inside that island, Covid-19 papers with different focuses, such as mental health impact, vaccines, symptoms, or treatments, are located in different areas. The map would allow the historian to navigate the Covid-19 literature through the different narrow topics and see how they interconnect. The historian would end up discovering that the Covid-19 literature is specially separated from the rest of the map in a way that other epidemics, like HIV or Ebola, are not. The map shows how — in only two years — the Covid-19 pandemic has had an unprecedented effect on the scientific literature.
The Map Mechanism
And how is the map created? We use machine learning methods to sort the abstract texts of the 20 million articles from PubMed by content and place them in the map. To do this, we use a large language model trained specifically on biomedical texts (PubMedBERT). This large language model, similarly to the one behind the chatbot ChatGPT, is an advanced machine learning system that learns from vast amounts of text data to “understand” texts.
Using this large language model, we translated the content of each abstract into numbers. Then, we used another machine learning method called t-SNE, that automatically places each abstract as a point in the 2D map, in a way that each paper is surrounded by similar papers in terms of content. Papers are then colored in the map by their discipline, or by other features, such as year of publication.
Large language models (LLMs) are able to perform impressive tasks. They can create human-like text, categorize texts, or translate them into a different language. Widely used tools like ChatGPT have the potential to increase productivity and facilitate autodidactic learning but at the same time raise questions of authorship and accuracy of the information provided. But how do LLMs learn? While these models don’t truly comprehend text like humans do, they excel at recognizing patterns. They are able to learn statistical relationships between words and their contexts, and to represent them with sets of numbers based on that. For example, in a sentence like “The cat sat on the mat.”, they may represent the word “cat” by the numbers [0.8, -0.4, 0.2], “sat” by [0.1, 0.6, -0.3], etc. Similar words in similar contexts get similar sets of numbers. That way, a whole sentence can be represented by a sequence of numbers instead of by plain words, without losing its content information. This is necessary when using machine learning methods because computers can only work with numbers.
Beyond literature research
As we are generally interested in machine learning, we used the map to analyze how different medical disciplines have adopted machine learning (ML) methods in their practice. Nowadays, more and more machine learning methods are being put to use in medicine for applications such as diagnosis or personalized treatment. The map shows that some medical specialties, such as radiology, have been faster at incorporating new tools than others, like gynecology, which still barely uses ML methods. This makes sense because radiology relies heavily on medical images, and ML methods that work with images have been extensively developed in the last years.
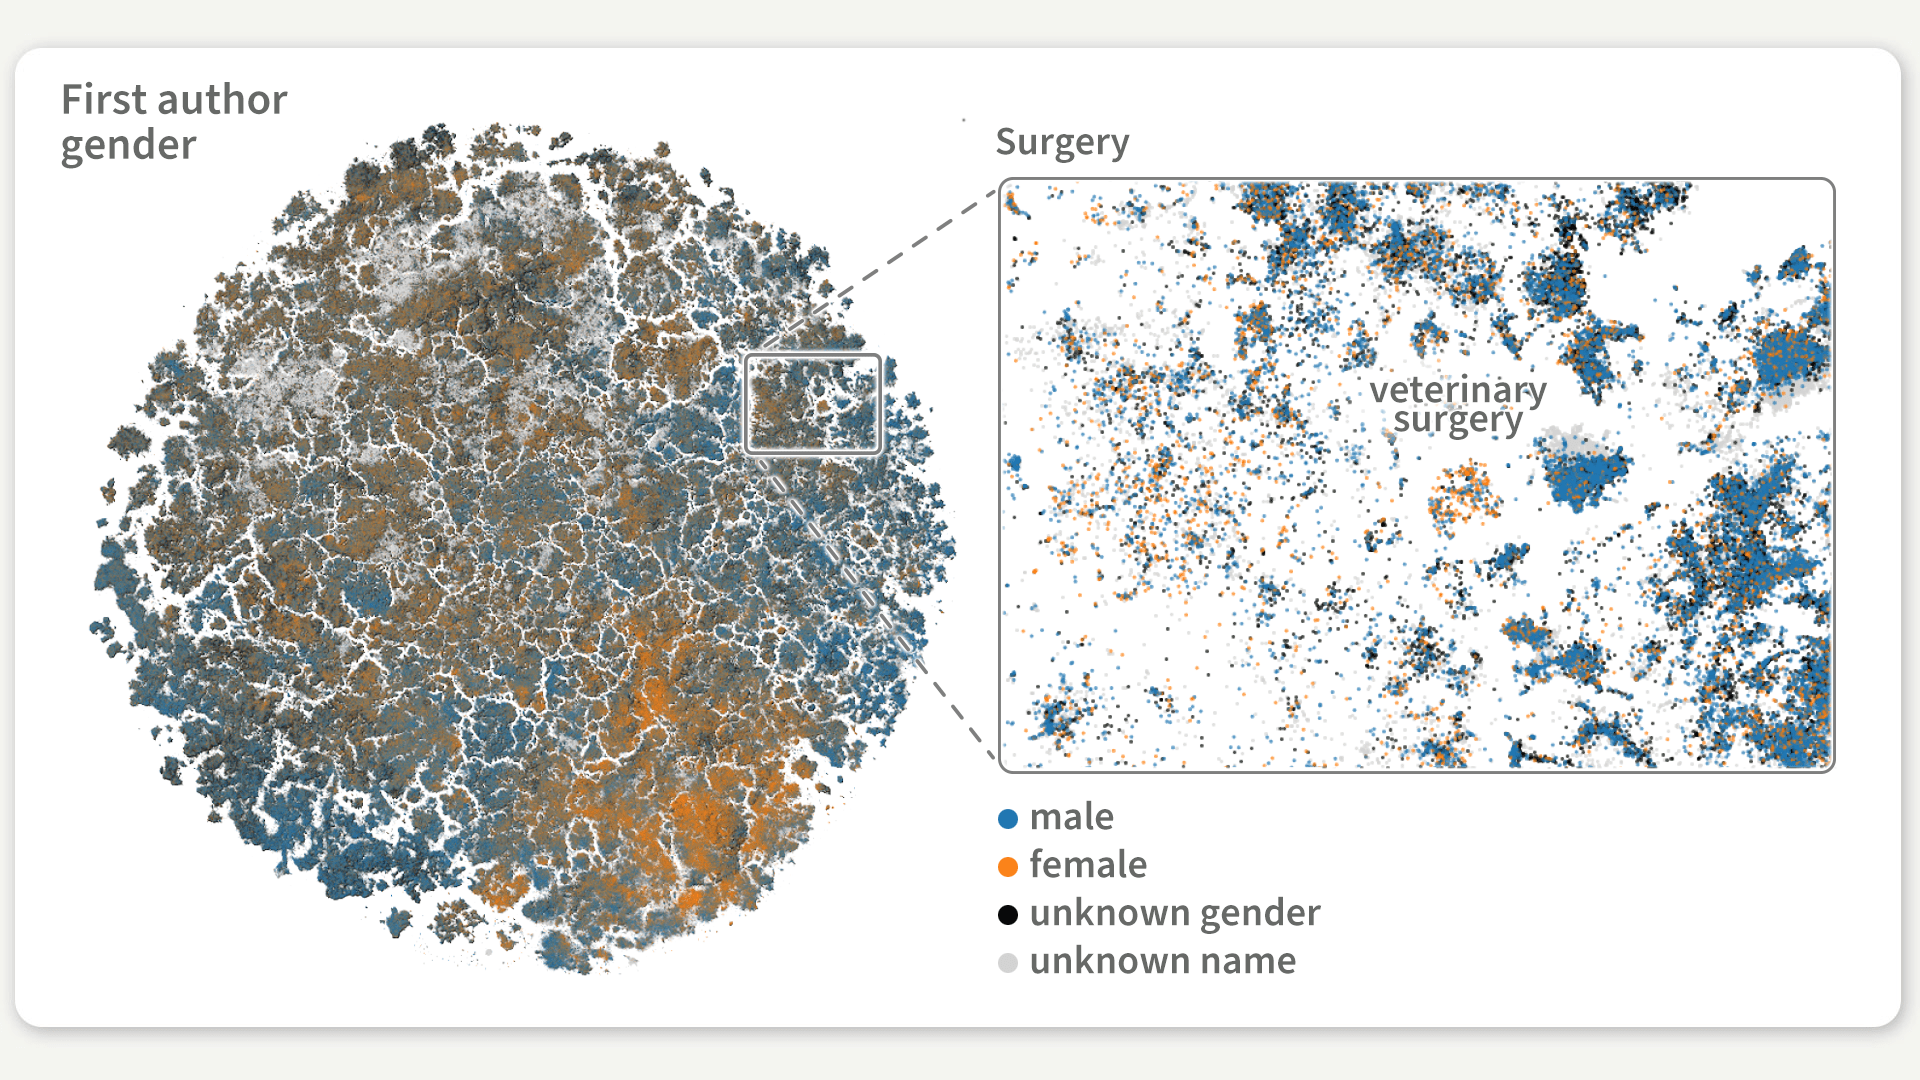
Figure 2: Map colored by inferred gender of the paper’s first author (blue: male, orange: female). The zoom-in shows an example island with a high-fraction of female authors inside a male-dominated discipline (see main text for more details).
Another problem of global interest in science is the gender bias in authorship. In the map, 42.4% of first authors and only 29.1% of last authors are women, which shows how few women are in supervisory roles in science. Female authors were also more frequent in the more social disciplines of biomedicine, like nursing, education, or psychology, and least frequent in the most technical disciplines, like physics, or informatics. From the purely medical domain, surgery was the discipline with the least amount of women (24.4%). The map allows us to go one step further and look at gender biases beyond disciplines. For example, we can zoom in inside the surgery discipline and find a region with a surprisingly high fraction of women (61.1%) that corresponds to a niche of papers on veterinary surgery, matching veterinary being a more female-dominated discipline (52.2% in total). The map clearly shows in which areas women are still underrepresented and it serves as a great tool to explore gender biases across the biomedical landscape.
Hints to fraudulent research and paper mills
After the first version of our map was released, we were contacted by a researcher interested in retracted papers in the map and their relation to “paper mills”. Retracted papers are papers that, after being published, are taken back, because of reasons like plagiarism, errors, ethical violations, or data fabrication and fraudulent research. Many of these retracted papers come from paper mills, which are for-profit organizations that produce and sell the authorship of fraudulent research papers (1, 2). If, for example, a doctor working in a hospital is required to publish a certain amount of papers a year, but does not have the time to conduct the research themselves, they could buy a ready-to-publish paper (sometimes even already accepted into a journal) from these paper mills and have their requirements easily fulfilled. In the map, retracted papers concentrated in certain research areas, such as cancer-related drugs, that are known to be targets of paper mills. The non-retracted papers in those areas were surprisingly similar to the retracted ones, which may be a sign that they come from paper mills too. The map could be used to inspect the regions with an unprecedentedly high fraction of retracted papers and identify suspicious papers that deserve further scrutiny.
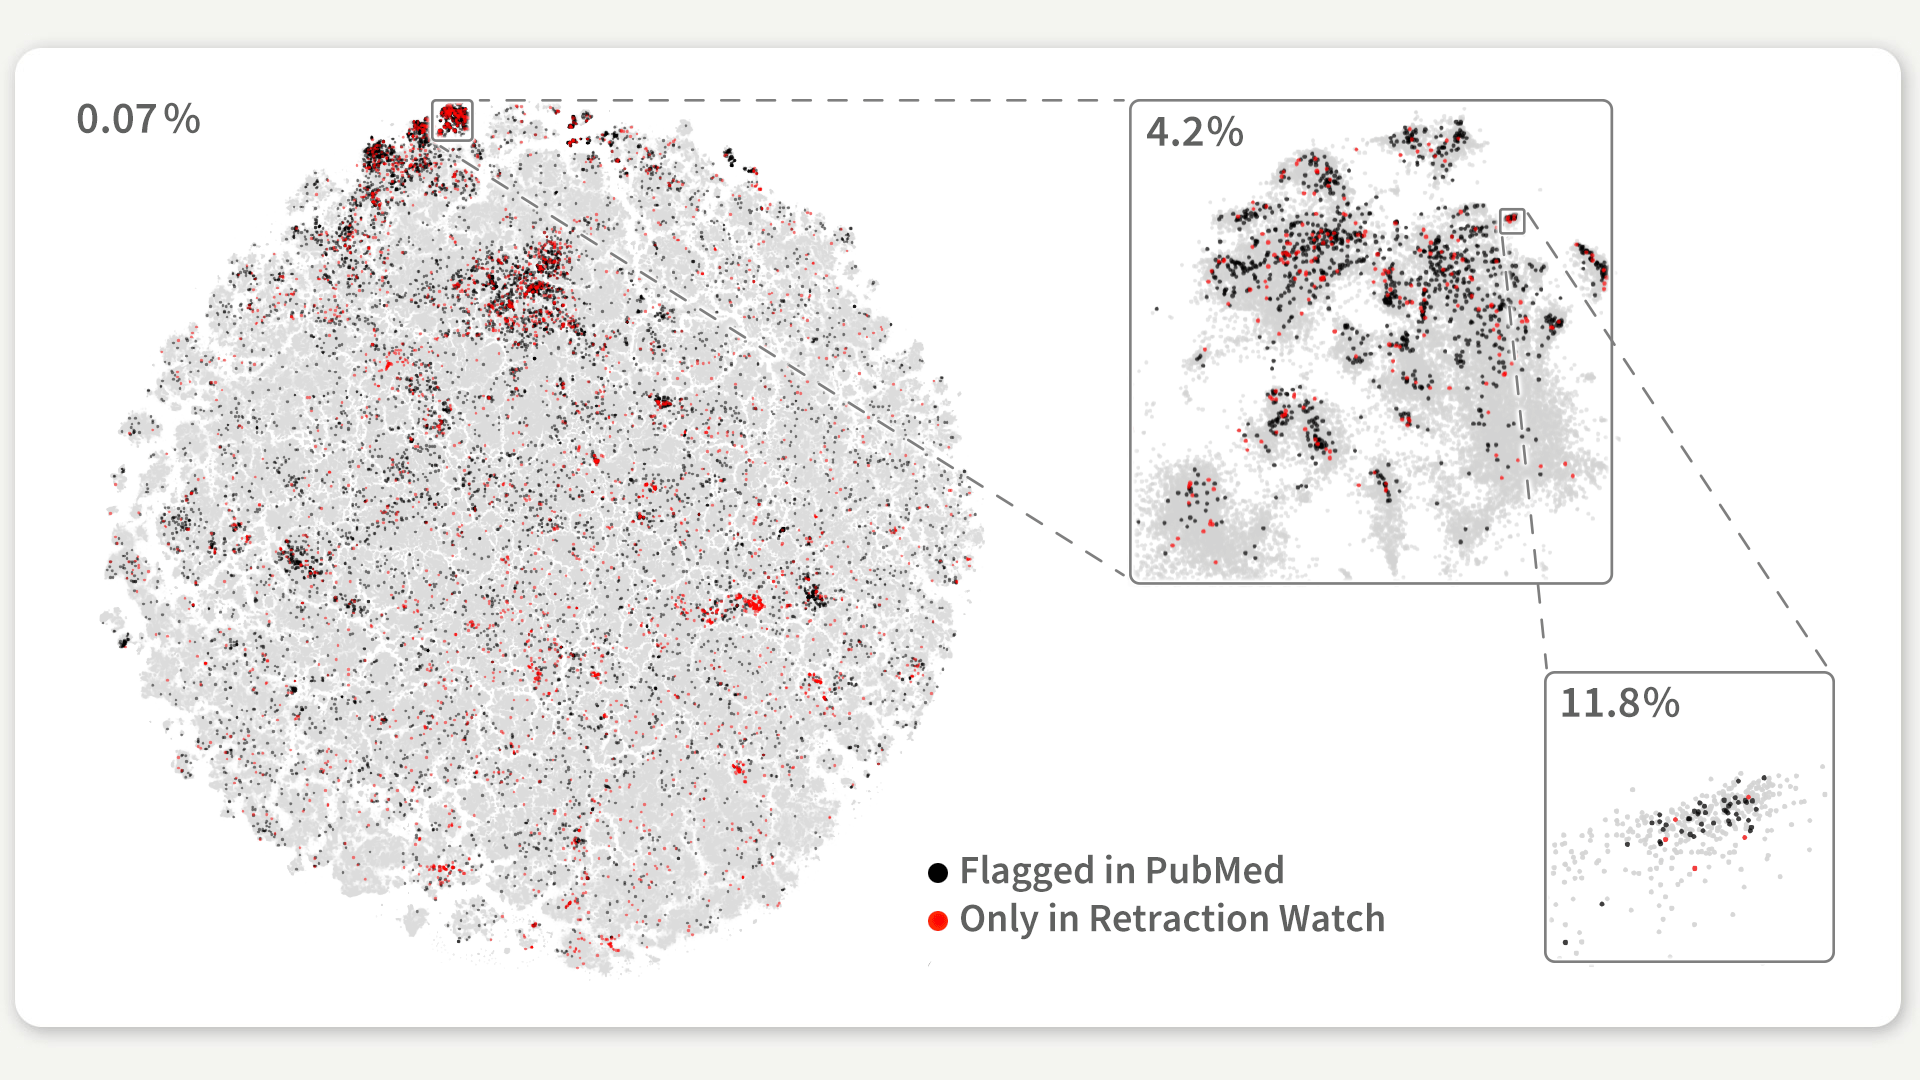
Figure 3: Retracted papers highlighted in the map and zoom-in of a region with an unprecedently high fraction of retracted articles. Percentages correspond to the fraction of retracted papers in the whole map and in the selected regions, where this number increases by a factor of 100.
These are only several of many different aspects that one could explore using the map of the biomedical landscape. It offers a new way of interactively exploring the data, that existing search engines don’t offer. The map has the potential to revolutionize the way researchers explore, navigate, and utilize the vast amount of biomedical and life science literature, ultimately helping advance the field of biomedical research.
Original paper: Rita González-Márquez, Luca Schmidt, Benjamin M. Schmidt, Philipp Berens, Dmitry Kobak: The landscape of biomedical research. Patterns (2024), https://doi.org/10.1016/j.patter.2024.100968
Cover illustration: Franz-Georg Stämmele

Better Understanding the Monsoons and the El Niño
Comments
Carolina Márquez, April 24, 2024
Extraordinary. Congratulations!!!!!